Sequence Alignment Diagram Drawing Tool

Input Data

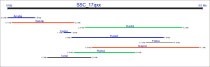
This tool takes the coordinates of the total length (0, length) and the (start) and (end) of each contig as input to draw the alignment graph. The data format is defined as on the right and sample data in the format is shown in the form below. You can detete them and put in yours to start.

Graph width: Data Format
(one line each for Backbone and Contigs):
 Name1, start#, end#, color_code
 Name2, start#, end#, color_code
 Name3, start#, end#, color_code

Color codes:
 0 - black
 1 - navy
 2 - red
 3 - green
 4 - blue
 5 - gray

NOTE: The name cannot contain any space. HINT: Fill in spaces with underscore ("_") as shown in the example.

Backbone:
Contigs:


© 2003-2025: USA · USDA · NRPSP8 · Program to Accelerate Animal Genomics Applications. Contact: Bioinformatics Team