Creating a Gene Map
|
"We shall not cease from exploration And the end of all our exploring Will be to arrive where we started And know the place for the first time." —T.S. Eliot |
Imagine for a moment that your heart's desire is a pair of boots that (you have discovered) can only be bought in Menahga, Minnesota. In order to own the boots of your dreams, you must first answer the question, "Where's Menahga?"
In the same way, our ability to select for or against production characteristics at the level of the gene depends on our ability to find the genes involved in producing the characteristics. Researchers interested in being able to encourage or eliminate a certain gene must also begin with the fundamental question: "Where is it?"
In the case of the hunt for the boot shop, the question can be answered in several ways. You could call and get directions to the town of Menahga, relative to someplace you already know—Duluth, perhaps, or Park Rapids. Or, you might pull out a map of Minnesota, highlight the town, and then trace your route there.
|
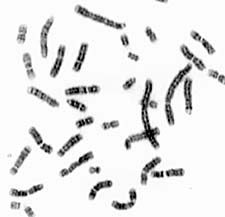
| Stained and magnified chromosome specimen of swine. |
Finding the Link
The most hotly pursued map of the pig genome today is one that locates a gene's position relative to that of other identifiable sign posts on the chromosome. Known as a linkage map, this type of representation does not tell where on a chromosome—or even necessarily on which chromosome—a particular gene is actually found. Rather, it indicates the probability that it will be inherited along with other known points in the genome.
Since linkage maps don't describe actual physical distances, early mapmakers were at a loss for words when it came to describing the relationship between two polymorphisms. The dilemma was soon solved by creating a new unit, the centiMorgan (cM), which describes not the actual proximity of two genes, but rather the likelihood that the two will tend to remain partners during meiosis, the process that creates haploid eggs and sperm (gametes). If two points are separated by a linkage distance of one cM, there is about a one in one hundred chance that they will be separated and end up in different gametes.
Several chromosome sites associated with specific desirable livestock characteristics have already been marked by researchers:
|
 "When there's a profile of markers that are statistically significant, [the impact] will be huge as far as being significant to animal breeders. It's coming closer and closer to reality. I think it will be very valuable to the swine industry." "When there's a profile of markers that are statistically significant, [the impact] will be huge as far as being significant to animal breeders. It's coming closer and closer to reality. I think it will be very valuable to the swine industry."—Lyle Baumgartner, swine seedstock producer. Windsor, Illinois |
Such information is valuable because if two genes are linked, they have a higher chance of being co-inherited—inherited together by an animal's offspring. This means that, if an animal has a certain marker, there is a high probability it also has the code for production characteristics which are linked to that marker but which have not yet been expressed phenotypically. This knowledge can then be applied to marker-assisted selection (MAS)—the process of choosing animals for breeding based on the markers that we know they have inherited (their genotype) and that we know are associated with the economically important traits (phenotypes) we desire.
Genetic linkage maps are created by observing in a population of animals of known relationship how often two polymorphisms are inherited together. When gametes (eggs and sperm) are formed, the two sets of chromosomes divide up so only half end up in each gamete. Genes on different chromosomes stand a more or less random chance of ending up in the same gamete. Genes on the same chromosome, on the other hand, obviously are quite likely to end up together—but surprisingly enough, not 100 percent likely. That's because, when the two chromosome sets part company to form gametes, occasionally bits of the chromosome the animal inherited from one parent trade places with the equivalent bits of chromosome that it inherited from the other. This "crossing over" means that even though two traits are carried on the same chromosome, they may not always be inherited together. The actual rate of recombination is determined by how far apart the two are on a gene; the closer they are, the less likely it is that they will be separated.
| As chromosomes sort themselves out into the two separate haploid sets that form eggs or sperm, they occasionally exchange bits of DNA in a process called crossing over or recombination. Pieces of DNA are considered "linked" if they are so close that they are highly unlikely to be separated in this way. |
Crossing over is an extremely useful tool in the world of gene mapping for the simple fact that the chance that two genes will be separated in this way is related to how close they are together on the chromosome. Just as it's much more likely that lightning will strike today between you and the West Coast than it is that it will strike between you and your next-door neighbor, the odds of a split occurring between two proximate genes are meager compared to those of one occurring between genes on opposite ends of a chromosome. Thus, by observing the frequency with which two genes are inherited together, we can get a pretty good notion of how relatively close they are to each other on the chromosomes. Not only that, but by doing this for different pairs of genes, we can determine the precise order in which the genes appear as well.
The payoff for this knowledge is a big one in the world of pork production. With a linkage map in hand, we can tell with great certainty whether an animal has inherited a specific gene by determining whether it has inherited the marker associated with it. Thus, if a marker is discovered that is linked to a gene contributing to prolificacy, a breeder could test for the presence of the marker in DNA obtained from blood samples to find out whether a newborn male pig inherited the prolificacy gene from his mother, rather than waiting an entire generation to discover whether he passes it along to his daughters.
Making Markers
| Among the most immediately useful pursuits in the realm of gene mapping today is the identification of markers. These are nucleotide sequences that are polymorphic (i.e., they exist and are inherited in different, easily distinguishable forms in different individuals) and are linked to genes for production traits which are not so readily observed. |
|
 "We're going to attempt to use marker-assisted selection to try and improve production efficiency and production quality. I see incorporation of it as a major tool."
| Genetic Markers | |
|---|---|
Type I
|
Type II
|
One of the first kinds of marker developed is the Type I marker, also known as a restriction fragment length polymorphism, or RFLP. These are DNA segments that encode for expressed DNA sequences that are inherited in different forms, one of which is recognized and cleaved by highly specific chemical scissors known as a restriction enzyme. When a restriction enzyme comes upon the specific sequence of nucleotides that it is equipped to cut (different sequences activate different restriction enzymes), it attaches to and splits the DNA at that site. Because the presence of the characteristic fragments can be detected in the laboratory, it is relatively easy to identify which of the forms of the RFLP was inherited—and so, which form of the linked production characteristic the animal carries—by treating a DNA sample with a restriction enzyme and biochemically observing the fragmentation pattern that results.
|
Genotyping uses genetic markers (RFLP and microsatellites) to generate "hard copies" of marker allele inheritance patterns. |
There are many different RFLPs, each with its own corresponding restriction enzyme. If the gene that codes for an economically important trait is known to be linked to (or to contain) an RFLP, the restriction enzyme then becomes a test for the production characteristic. To date, more than 20 Type I markers that are linked to genes of interest in swine have been described. Additional research is focused on identifying even more RFLP sites and linking them to relevant traits.
A second type of marker, the Type II marker, is based on common chromosomal quirks that are known as microsatellites. These are stretches of otherwise meaningless DNA in which a simple pattern of nucleotides is repeated over and over. The length of this genetic "stutter" is polymorphic—for example (though in reality most are much longer, on the order of 100 to 300 nucleotides), an animal might carry on one chromosome the sequence [ATCAA(GT)20ATGCT] and at the equivalent spot on the other member of the chromosome pair the sequence [ATCAA(GT)28ATGCT].
If we know the sequence of the nucleotides on either side of the microsatellite (the "ATCAA" and "ATGCT" in the example here), we can use a laboratory technique known as polymerase chain reaction (PCR) to make millions of copies of just the stretch of DNA containing the microsatellite. And once we have a pile of microsatellite copies on hand, it's a relatively simple procedure to identify whether an offspring has inherited the long or the short form of the microsatellite—and so which copy of the linked gene of economic importance has been passed along.
Researchers already have mapped more than 400 microsatellite markers in swine. Because microsatellites have the advantage of having a higher heterozygosity than RFLPs (that is, they are more likely to appear in different forms in different animals), such markers are likely to play an increasingly key role in the further elucidation of the pig genome.
| The Toolbox |
|---|
| Our ability to look at the gene today is a product of extensive research during the 1980s and 1990s that yielded a toolbox full of techniques for manipulating genes. The names may be fancy, but just like more conventional toolbox occupants, their function is simply to extend the capabilities of our own hands to get a job done. Some of the tools and their tasks:
restriction enzymes—proteins that recognize specific patterns of nucleotides within a stretch of DNA and cut the DNA at the sites where those patterns occur. For example, the restriction enzyme EcoRI will cut DNA when it encounters the nucleotide pattern GAATTC. polymerases—proteins that synthesize DNA from individual nucleotides using one of the DNA strands as a template. polymerase chain reaction (PCR)—a molecular assembly line technique for making millions of copies of a DNA fragment. PCR is valuable because it makes it easier to study or to test for the presence of a particular chunk of DNA in a small blood or tissue sample. |
Marking the Spot
A detailed genetic linkage map is only one of the goals of genetic mapping. Researchers also are working to create a second type of map, known as a physical map. This kind of map identifies the location of genes and markers on specific parts of specific chromosomes. A physical map is important because it allows scientists to hone in on a gene of interest to study its actual chemical makeup and so better understand and perhaps eventually modify how it contributes to or detracts from the productivity of the food animal.
At the lowest level of resolution, physical maps are simply drawings of the patterns of light and dark bands that appear on chromosomes observed under a microscope. At the highest level of resolution, physical maps consist of actual descriptions of the lineup of bases along the DNA. Although we have known for some time how to create both very low and very high resolution maps, their utility is limited by the very fact that they represent the two extremes of the spectrum. With nothing in between, the information these two kinds of physical maps provide is about as useful as a satellite photo of the earth and a floor plan of your host's home when you're trying to find a party.
Detecting Molecular-Level Differences
A five-year-old can readily group animals based on traits he or she can see, such as hair color or size. But what about the subtle biochemical traits used as markers—such as the presence of a microsatellite or a gene coding for a certain protein? How can we tell which of the two possible options an animal has inherited from each of its parents?
The answer lies in a biochemical sorting technique known as electrophoresis. It allows us to capitalize on how various molecules congregate in distinct and predictable ways when exposed to a known set of physical conditions in a given setting—much as a crowd at a party tends to segregate into food-hoverers, baseball-game-watchers, volleyball players, and other distinct and fairly predictable patches of people.
 By separating DNA fragments from each other using the technique of electrophoresis, researchers determine which genetic markers—potentially linked to economically important traits—an animal has inherited from its parents. |
For detecting the presence of specific DNA fragments, the setting is a thin layer of agarose or acrylamide gel. The conditions are an electrical field applied across its surface.
When a sample of DNA—either restriction-enzyme-digested genomic DNA or polymerase chain reaction (PCR) amplified microsatellite—is placed on the gel and exposed to current, the various molecules move in different directions at different speeds, depending on their size, shape and electrical charge. After an hour or two of electricity and application of an appropriate stain, the original sample has become an array of short stripes, each indicating the presence of one or another of the various molecules comprising the original sample.
By comparing the striping pattern of an animal with those of its parents, we can fairly easily determine which version of a marker allele—and so, which of the associated genes of economic interest—that animal has inherited.
Fortunately, techniques recently have become available that allow us to get at the middle ground—the genetic equivalent of state and city road maps. The most common way of doing so is to make copies of the DNA section we want to locate, tag them with radioactive or fluorescent labels, and then mix them with intact chromosomes—a process known as in situ hybridization. (When the label is fluorescent, the technique is referred to as fluorescence in situ hybridization, or FISH.) The tagged DNA selectively binds to matching sites on the chromosomes, and its location can then be observed using radiosensitive or light-sensitive film.
The most hotly pursued sites on physical maps are those that contain restriction fragment length polymorphisms (RFLPs) of Type I or DNA that is expressed as muscle protein. Because many of these sites have been identified on linkage maps, they hold the key to correlating the two types of maps into a single, clear picture of the layout of the pig genome.
| A Family Affair | |
|---|---|
| In order to create maps linking genes and markers, researchers must first have in hand a sample of genetic material from animals that both are related to each other and show a lot of genetic variability among them. Much of the early swine genome mapping work, therefore, has focused on developing a few good reference families—groups of related but genetically varied animals (usually three generations). Genetic material from these animals along with information about their relationship to each other is distributed to swine genome researchers around the world for use in their mapping efforts. Reference families have been established for swine at the University of Illinois, in the U.K. and in Sweden, and at the U.S. Agricultural Research Service Meat Animal Research Center in Clay Center, Nebraska. By sharing DNA samples and/or genetic markers from existing reference populations, researchers accelerate the process of creating a comprehensive map of the pig genome. Another kind of family encountered in swine genome research is called the resource family. This is again a group of related animals, some of which show a characteristic of interest such as good marbling, larger litter size, or resistance to porcine stress syndrome. For members of resource families, researchers have both genetic material and information about which of the related individuals exhibit that specific characteristic. With both genotypic and phenotypic information at hand, they can then get a handle on how specific traits are inherited, and identify genes responsible for these traits. | |
| |
|
| Details, Details, Details |
|---|
| Gene maps can be drawn to different degrees of resolution, or detail. Just as you might describe the location of your own home as part of a particular planet, continent, country, city, or even neighborhood, genes can be located broadly at the level of the chromosome, or, with much more work, pinpointed down to the exact base pairs that make them up and their precise location along the huge strand of DNA that makes up that chromosome. The degree of resolution at which individual scientists work is related largely to the goals of their individual research projects, and to the tools they use to create the map. Because of the unfathomable amount of information contained within the genome, a high level of detail is not always desirable. In the same way that a globe is more useful than a Kathmandu street map for finding the distance between Nepal and Iowa, a low-resolution gene map may be the best bet for researchers trying to identify the genetic source of a specific production problem in pigs. That's not to say that detailed maps are useless, however. Information as precise as the exact sequence of specific base pairs may one day enable researchers to manipulate minute parts of the genetic code to make even greater advances in combating disease, eliminating undesirable characteristics and enhancing economically important traits. |
 "Our new tools of biotechnology open to us a new era of opportunities to understand and map the unknown, and in doing so to improve the health, production traits and consumer needs of livestock and their products."
—C. Eugene Allen, vice president |
| What Genome Mapping Isn't |
|---|
| Perhaps as important as understanding what genome mapping is, is to understand what it is not. Although it holds much potential for improving the species, it is not a quick-and-dirty formula for a superpig. Although at some point it may provide the basis for future efforts to actually modify genes in order to improve them, it is not currently a technique for engineering or manipulating the content or activity of individual genes. Simply put, the primary aim of the gene mapping program is to do just that—create a map of a species' genome. Such a map could make it possible for producers to apply selective breeding at the level of the molecule rather than of the whole organism. Success at doing this should increasing the efficiency and effectiveness of breed improvement programs. |